In preparation for the Fluo beta 2 release, Webindex, an example Fluo application, was run on 24 EC2 m3-xlarge nodes (20 worker node) for 3 days. The experiment went well as Webindex indexed 178 million web pages and 2.32 billion links. The average rate for the entire test was 698 pages/sec and 8,943 links/sec. A few problems with Fluo Recipes and Webindex were discovered during the course of the test.
Webindex Overview
Webindex indexes URLs from Common Crawl data in multiple ways into an external Accumulo table. Webindex offers a simple web application for querying this external Accumulo table. The following three questions can be answered from this web page.
- Which page is the most linked to?
- Which page in a domain is the most linked to and how many pages were seen for a domain?
- For a given page, what links to it and how many links are there?
In order to answer these questions, Webindex continually updates the following three indexes in an external Accumulo table.
- A per domain index containing linked to counts in descending order.
- A total index containing linked to counts for all pages in descending order.
- A per page index containing the pages incoming and outgoing links and incoming link count.
The following is a simple example of some of what Webindex does. In order to keep it simple, the example below does not show everything Webindex does.
- Content for
http://A.comthat links tohttp://B.orgis loaded. - Content for
http://C.comthat links tohttp://B.orgis loaded. - The inbound link count for
http://B.orgis computed as 2. (2,http://B.org)is inserted into the external domain index, total index, and page count.- Content for
http://C.comthat links tohttp://B.orgis loaded. - The inbound link count for
http://B.orgis computed as 3. (2,http://B.org)is deleted from all the external indexes and(3, http://B.org)is inserted.
Videos from run
During the course of the 3 day run, screenshots of different queries in the Webindex web application were taken every 6 minutes. From these screenshots, the following videos were created showing Fluo in action. Keep in mind that as the counts are changing, the old count is deleted and a new count is inserted. If Fluo ever dropped the ball on this, it would leave both entries in the external index causing the same URL to show up twice with different counts.
The video below shows querying for the most linked to page every 6 minutes.
The video below shows querying for which pages at stackoverflow.com are the most linked to. The count at the top is the total number of pages seen in the wikipedia.org domain.
Videos were also created for apache, wikipedia, github, and cnn
Some custom scripts and pageres-cli were used to generate the screenshots. Videos with a screenshot every minute are also available. If interested in seeing these, contact the Fluo dev list.
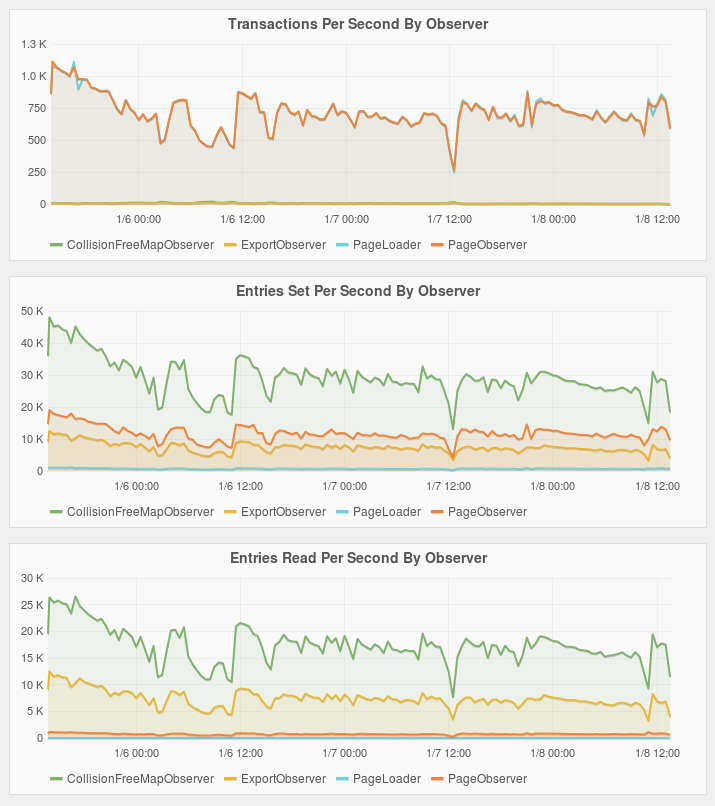
Grafana plots
The Grafana plots below are from the three day run. No plot of notifications queued is shown because processing of pages kept up and never fell behind. To understand the plots, below is a simple description of what the different observers do. Observers are written by Fluo users, run by Fluo workers, and respond to notifications and execute transactions.
- The PageLoader runs in a Spark job and loads pages parsed from a CommonCrawl data file.
- The PageObserver processes updates to pages, determines what links changed, and pushes link updates to other observers.
- The CollisionFreeMapObserver computes linked to counts and pushes the counts to the ExportObserver. This observer also rolls up domain counts and pushes those for export (calling different code and operating on a different part of the table).
- The ExportObserver updates the external Accumulo index table in a fault tolerant manner.
Problems Found
The test was useful in that it showed Fluo is probably ready for another release. While no show stoppers were found, it was also useful in that many areas where improvements could be made were found.
During the first day of the test, it was noticed that major compactions in Accumulo were sucking up a lot of resources. Each node only had four cores. Before the test were started, compaction ratios were adjusted. Fluo’s table was set to 1.5 and the external index table was set to 2. These ratios coupled with the fact that the compactions were using gzip caused really high load, which eventually caused processing to drop to around 500 pages/sec. While the test was running the compaction ratios were adjusted to 2 and 3, and compaction was set use snappy. This caused performance to increase. A few more cores would have been nice.
The Spark load jobs have to parse, validate, and clean up all of the links. This seems to be very CPU intensive and may be the current bottleneck (see fluo-io/webindex#41). It seems that as Accumulo’s CPU load increased (because of compactions) that the load rate dropped. As an experiment during the 2nd day of the test, loaders were stopped and two loaders per node were started. This resulted in a higher load rate of around 1000 pages/sec. In order to ensure the test would run over night, this was only done for a brief period before reverting to one loader per node. Again, more cores would have been nice. In place of more cores, looking into optimizing this and getting a higher load rate would nice. Another issue noticed with loading was fluo-io/webindex#39.
While monitoring the test it became apparent that split points for the Fluo table were not equally spreading computation across all tablet servers. See fluo-io/fluo-recipes#44 for more information. Somewhere around the 2nd day of the test, tablets were merged and new splits points were added while the test was running. This worked really well. Another issue found relating to split points was fluo-io/webindex#40.
The lack of metrics about Conditional mutations from Accumulo tablet servers makes it hard to track down problems where many Fluo transactions are hitting a few tablet servers. The bad split points mentioned in the previous paragraph are one example of this type of problem. ACCUMULO-4107 was created to address this issue.
Some skew was noticed as a result of YARN’s placement decisions. This was caused by coordination task displacing CPU intensive task. For example Fluo has three task types that run in YARN : Oracle, Twill Application manager, and Workers. Ideally there would be one Worker per node. However, because of the Oracle and Application task, YARN may place two workers on a single node. Opened fluo-io/fluo#600.
During the test, worker task were dying or being killed because of memory overuse. Twill/YARN automatically restarted the workers and the test kept running w/o much problem. It would be good to avoid this since this causes transaction recovery or rollback. See fluo-io/webindex#42.
The test identified a possible need for HashedRow recipe to more evenly distribute processing of page related transactions.
Test environment
The following configuration and software were used for this test.
- 24 m3.xlarge EC2 nodes. 15G ram, 4 cores, and 2x35G SSD.
- Centos 7
- Hadoop 2.6.0
- Zookeeper 3.4.7
- Accumulo 1.8.0-SNAPSHOT with ACCUMULO-4066 patches
- Fluo beta-2-SNAPSHOT 78bcdb7
- Fluo recipes beta-1-SNAPSHOT 96858d0
- Fluo deploy 43bf08f
- 2G data cache and 768M index cache in Accumulo
- 64 threads in Accumulo client pool and readahead pool
- 128 worker threads and 4G per worker (initially went to 5G and 6G as test was running).
- 20 Load task running in Spark
Storage statistics
After the three day run completed, the external index table had 4.71 billion entries and used 191G in HDFS. A compaction was forced on the Accumulo table, which caused old versions and deleted data to be dropped. After the compaction the table had 4.02 billion entries and used 159G in HDFS. The table was being frequently updated by Fluo and that’s why so much data was dropped by the compaction. The way Accumulo works, compactions were continually happening while test was running. So the total amount of data dropped from the table as a result of updates is unknown.
The table used by Fluo had 1.46 billion entries at the conclusion of the test and used 93G in HDFS.
Future Work
Most Fluo scale testing to date has been on EC2. It would be really nice to test Fluo on bare metal. We are going to experiment with getting Fluo Deploy to work on bare metal where CentOS 7 is already installed.
Seeing Application level stats plotted in Grafana, as outlined in fluo-io/fluo#534, would be really nice. For webindex this would include things like URLs exported per second, domains exported per second, etc. This issue was not identified during this test, it just would have been really nice to have this information while running the test.
Eventually this test needs to be run on 10, 20, and 40 nodes to measure the relative performance increase as the number of nodes is increased. Ideally this test would run on bare metal.
View all posts in the news archive