Fluo 1.2.0 documentation >> Administration >> Metrics
Metrics
A Fluo application can be configured (in fluo-app.properties) to report metrics. When metrics are configured, Fluo will report some ‘default’ metrics about an application that help users monitor its performance. Users can also write code to report ‘application-specific’ metrics from their applications. Both ‘application-specific’ and ‘default’ metrics share the same reporter configured by fluo-app.properties and are described in detail below.
Configuring reporters
Fluo metrics are not published by default. To publish metrics, configure a reporter in the ‘metrics’ section of fluo-app.properties. There are several different reporter types (i.e Console, CSV, Graphite, JMX, SLF4J) that are implemented using Dropwizard. The choice of which reporter to use depends on the visualization tool used. If you are not currently using a visualization tool, there is documentation at end of this page for reporting Fluo metrics to Grafana/InfluxDB.
Metrics names
When Fluo metrics are reported, they are published using a naming scheme that encodes additional
information. This additional information is represented using all caps variables (i.e METRIC)
below.
Default metrics start with fluo.class or fluo.system and have following naming schemes:
    fluo.class.APPLICATION.REPORTER_ID.METRIC.CLASS
    fluo.system.APPLICATION.REPORTER_ID.METRIC
Application metrics start with fluo.app and have following scheme:
fluo.app.REPORTER_ID.METRIC
The variables below describe the additional information that is encoded in metrics names.
APPLICATION- Fluo application nameREPORTER_ID- Unique ID of the Fluo oracle, worker, or client that is reporting the metric. When running in YARN, this ID is of the formatworker-INSTANCE_IDororacle-INSTANCE_IDwhereINSTANCE_IDcorresponds to instance number. When not running in YARN, this ID consists of a hostname and a base36 long that is unique across all fluo processes.METRIC- Name of the metric. For ‘default’ metrics, this is set by Fluo. For ‘application’ metrics, this is set by user. Name should be unique and avoid using period ‘.’ in name.CLASS- Name of Fluo observer or loader class that produced metric. This allows things like transaction collisions to be tracked per class.
Application-specific metrics
Application metrics are implemented by retrieving a MetricsReporter from an Observer, Loader,
or FluoClient. These metrics are named using the format fluo.app.REPORTER_ID.METRIC.
Default metrics
Default metrics report for a particular Observer/Loader class or system-wide.
Below are metrics that are reported from each Observer/Loader class that is configured in a Fluo
application. These metrics are reported after each transaction and named using the format
fluo.class.APPLICATION.REPORTER_ID.METRIC.CLASS.
- tx_lock_wait_time - Timer
- Time transaction spent waiting on locks held by other transactions.
- Only updated for transactions that have non-zero lock time.
- tx_execution_time - Timer
- Time transaction took to execute.
- Updated for failed and successful transactions.
- This does not include commit time, only the time from start until commit is called.
- tx_with_collision - Meter
- Rate of transactions with collisions.
- tx_collisions - Meter
- Rate of collisions.
- tx_entries_set - Meter
- Rate of row/columns set by transaction
- tx_entries_read - Meter
- Rate of row/columns read by transaction that existed.
- There is currently no count of all reads (including non-existent data)
- tx_locks_timedout - Meter
- Rate of timedout locks rolled back by transaction.
- These are locks that are held for very long periods by another transaction that appears to be alive based on zookeeper.
- tx_locks_dead - Meter
- Rate of dead locks rolled by a transaction.
- These are locks held by a process that appears to be dead according to zookeeper.
- tx_status_
<STATUS>- Meter- Rate of different ways (i.e
<STATUS>) a transaction can terminate
- Rate of different ways (i.e
Below are system-wide metrics that are reported for the entire Fluo application. These metrics are
named using the format fluo.system.APPLICATION.REPORTER_ID.METRIC.
- oracle_response_time - Timer
- Time each RPC call to oracle for stamps took
- oracle_client_stamps - Histogram
- Number of stamps requested for each request for stamps to the server
- oracle_server_stamps - Histogram
- Number of stamps requested for each request for stamps from a client
- worker_notifications_queued - Gauge
- The current number of notifications queued for processing.
- transactor_committing - Gauge
- The current number of transactions that are working their way through the commit steps.
Histograms and Timers have a counter. In the case of a histogram, the counter is the number of times
the metric was updated and not a sum of the updates. For example if a request for 5 timestamps was
made to the oracle followed by a request for 3 timestamps, then the count for oracle_server_stamps
would be 2 and the mean would be (5+3)/2.
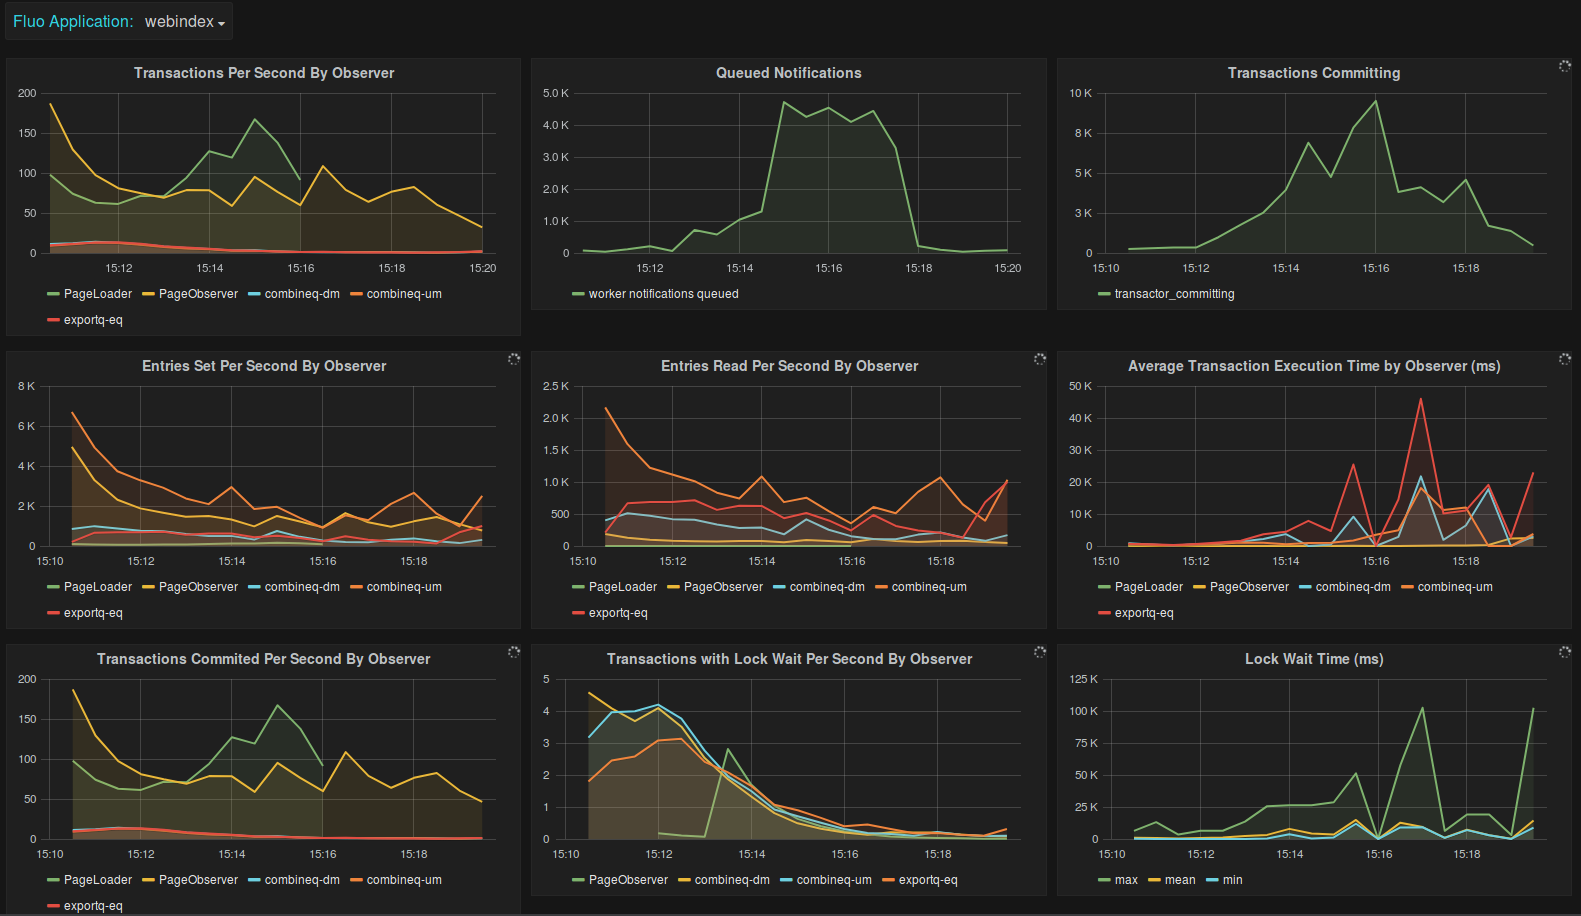
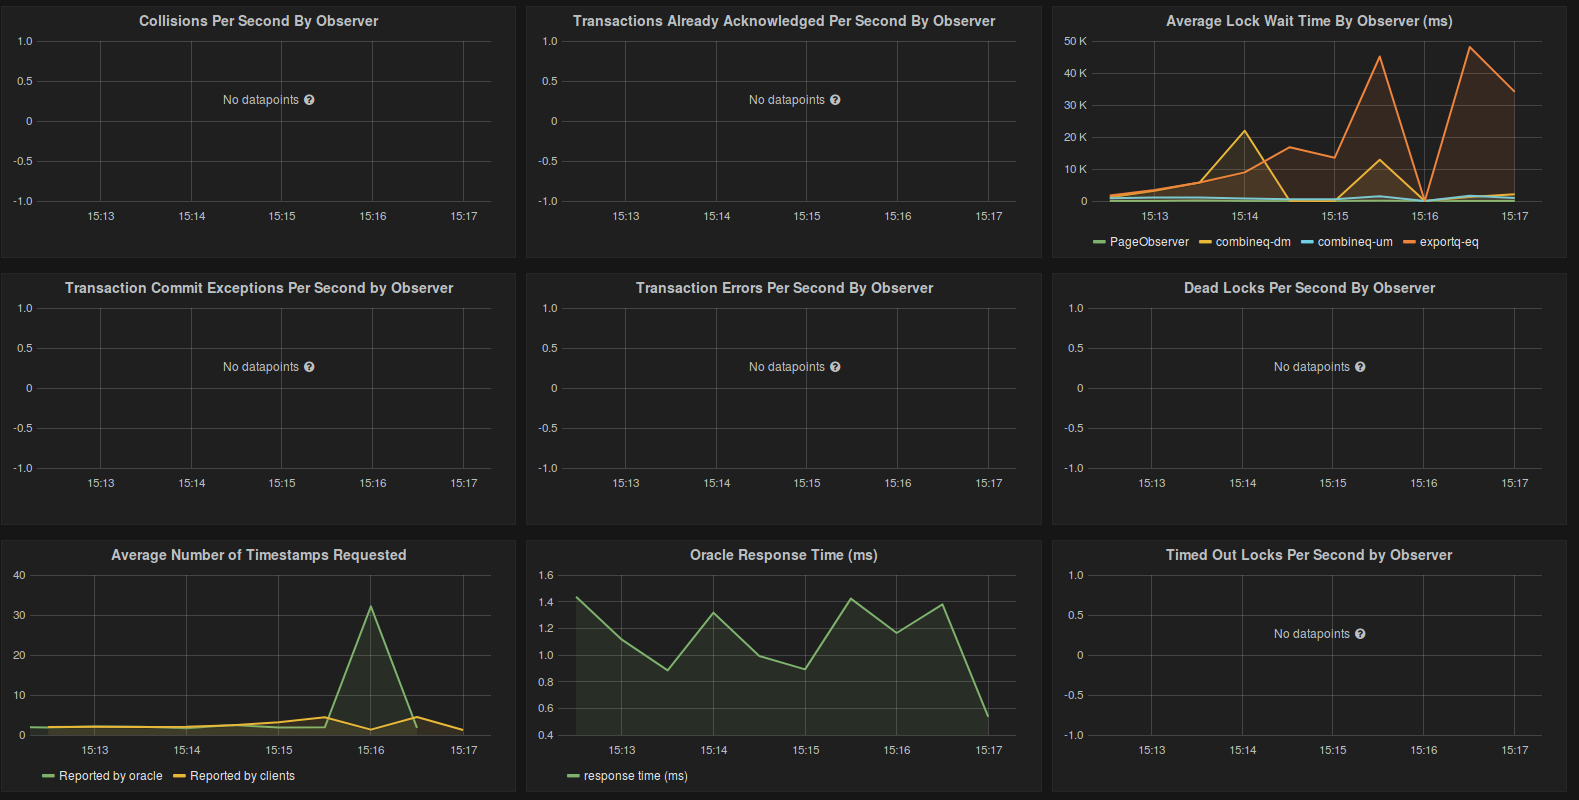
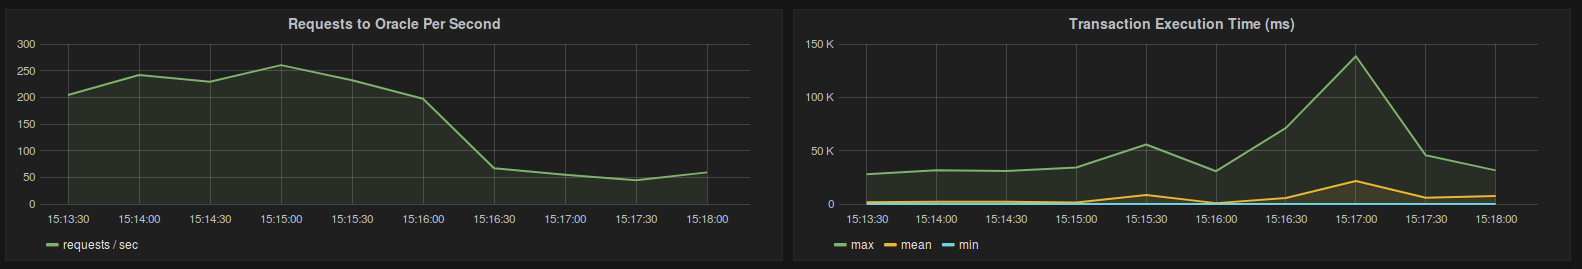
View metrics in Grafana/InfuxDB
Fluo metrics can be sent to InfluxDB, a time series database, and made viewable in Grafana, a visualization tool. Below is a screenshot of Fluo metrics in Grafana:
Following the instructions below to set this up:
-
Follow the standard installation instructions for InfluxDB and Grafana. As for versions, the instructions below were written using InfluxDB v0.9.4.2 and Grafana v2.5.0.
-
Add the following to your InfluxDB configuration to configure it accept metrics in Graphite format from Fluo. The configuration below contains templates that transform the Graphite metrics into a format that is usable in InfluxDB.
[[graphite]] bind-address = ":2003" enabled = true database = "fluo_metrics" protocol = "tcp" consistency-level = "one" separator = "_" batch-size = 1000 batch-pending = 5 batch-timeout = "1s" templates = [ "fluo.class.*.*.*.*.* ..app.host.measurement.observer.field", "fluo.class.*.*.*.* ..app.host.measurement.observer", "fluo.system.*.*.*.* ..app.host.measurement.field", "fluo.system.*.*.* ..app.host.measurement", "fluo.app.*.*.* ..host.measurement.field", "fluo.app.*.* ..host.measurement", ] -
Fluo distributes a file called
fluo_metrics_setup.txtthat contains a list of commands that setup InfluxDB. These commands will configure an InfluxDB user, retention policies, and continuous queries that downsample data for the historical dashboard in Grafana. Run the command below to execute the commands in this file:$INFLUXDB_HOME/bin/influx -import -path $FLUO_HOME/contrib/influxdb/fluo_metrics_setup.txt -
Configure the
fluo-app.propertiesof your Fluo application to send Graphite metrics to InfluxDB. Below is example configuration. Remember to replace<INFLUXDB_HOST>with the actual host.fluo.metrics.reporter.graphite.enable=true fluo.metrics.reporter.graphite.host=<INFLUXDB_HOST> fluo.metrics.reporter.graphite.port=2003 fluo.metrics.reporter.graphite.frequency=30The reporting frequency of 30 sec is required if you are using the provided Grafana dashboards that are configured in the next step.
-
Grafana needs to be configured to load dashboard JSON templates from a directory. Fluo distributes two Grafana dashboard templates in its tarball distribution in the directory
contrib/grafana. Before restarting Grafana, you should copy the templates from your Fluo installation to thedashboards/directory configured below.[dashboards.json] enabled = true path = <GRAFANA_HOME>/dashboards -
If you restart Grafana, you will see the Fluo dashboards configured but all of their charts will be empty unless you have a Fluo application running and configured to send data to InfluxDB. When you start sending data, you may need to refresh the dashboard page in the browser to start viewing metrics.